Penrose diagram
A conformal diagram mapping causal structure of spacetime.

Karl Hilpolt · CC BY-SA 4.0
A Penrose diagram is a two-dimensional diagram in theoretical physics that captures causal relations between different points in spacetime through a conformal treatment of infinity. Named after mathematical physicist Roger Penrose, it extends the Minkowski diagram of special relativity to curved spacetimes such as those in general relativity, with the vertical dimension representing time and the horizontal dimension representing a space dimension. All light rays take a 45° path (c=1), and the entire infinite spacetime is transformed into a diagram of finite size, with infinity on the boundary.
- field
- Theoretical physics
- known_for
- Penrose diagram (also called Penrose–Carter diagram or conformal diagram)
Lore & Background
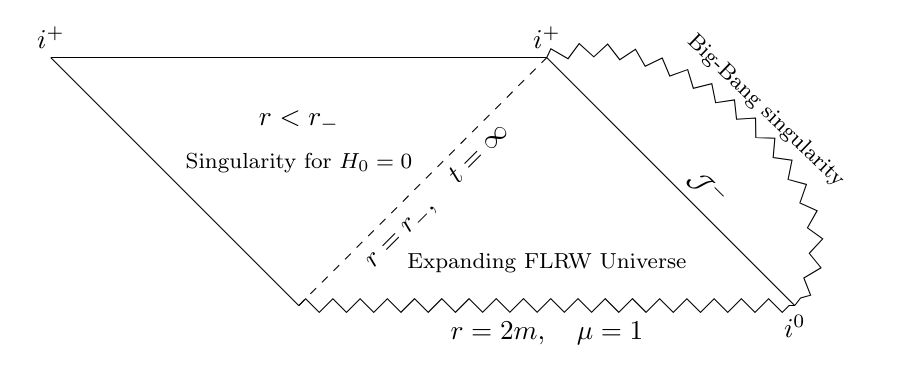
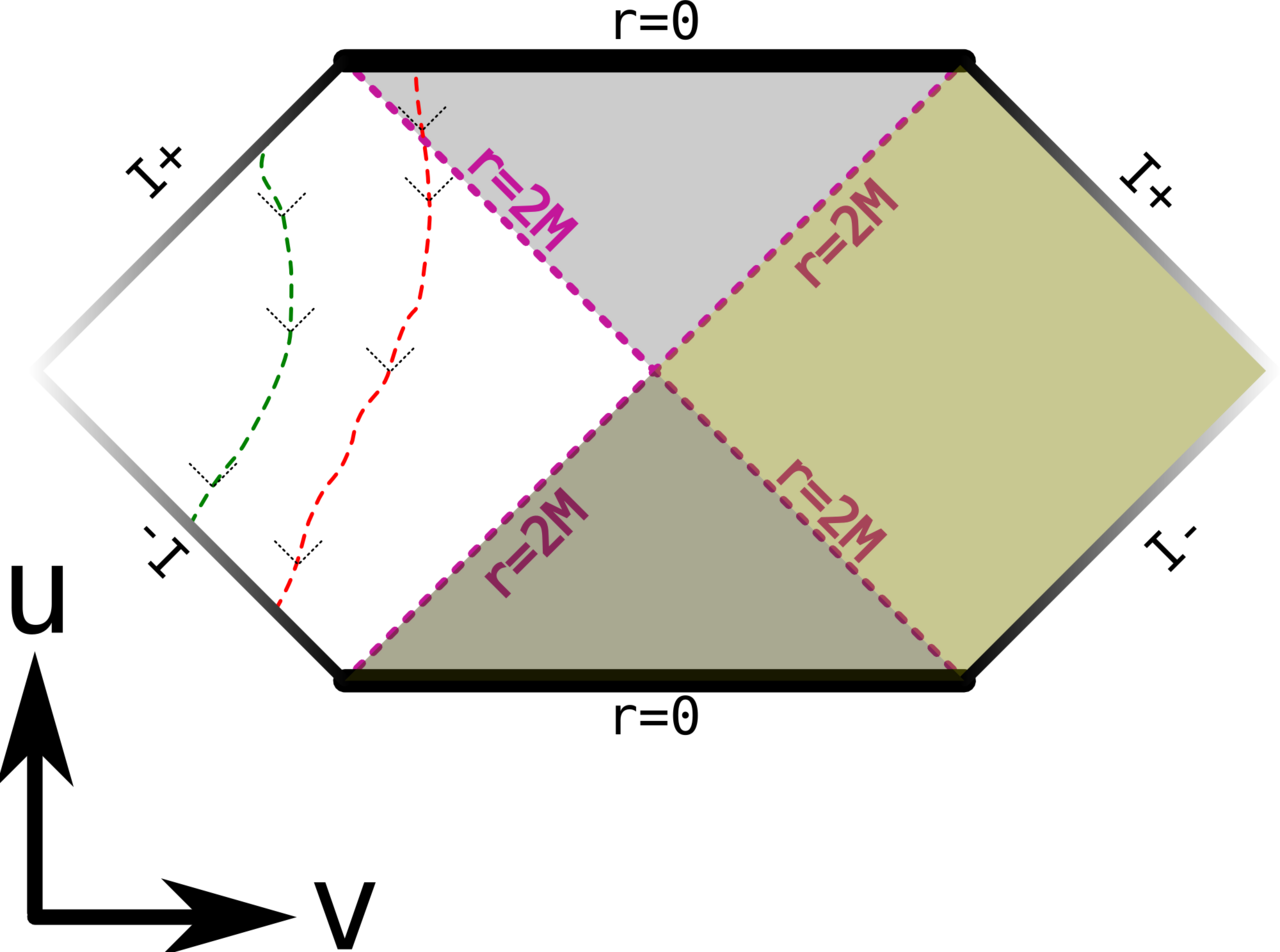
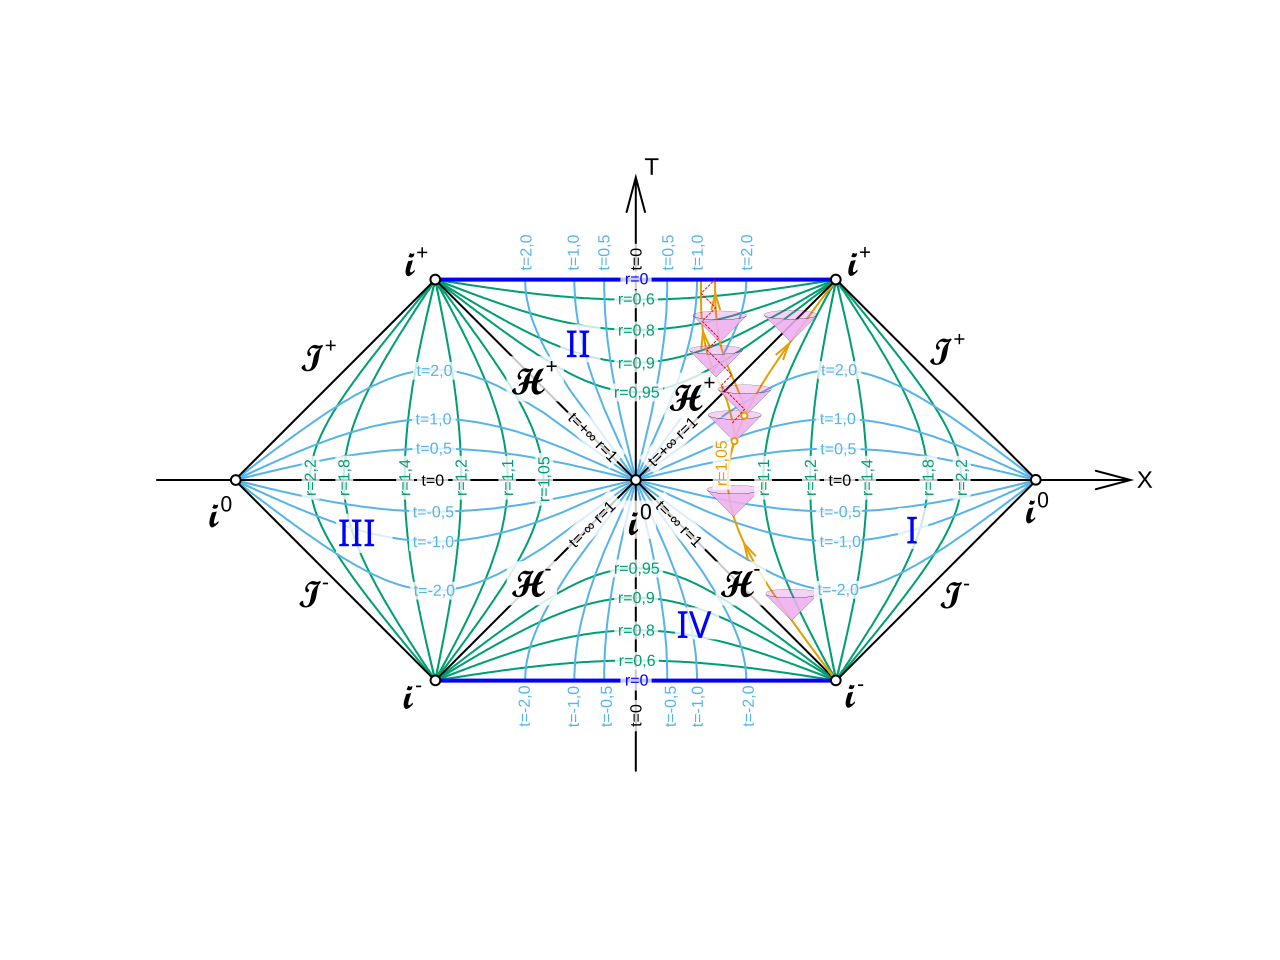
Penrose diagrams share the same basic coordinate vector system as other spacetime diagrams for local asymptotically flat spacetime, but introduce a system by which spacetime distances considered infinitely far away are compactified into finite locations. Straight lines of constant time and constant space coordinates become curves that appear to converge at points in the corners of the diagram, representing conformal infinity. The diagonal boundary lines correspond to null infinity or to singularities where light rays must end.
Reader's Guide
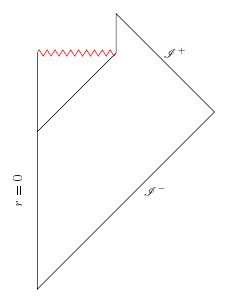
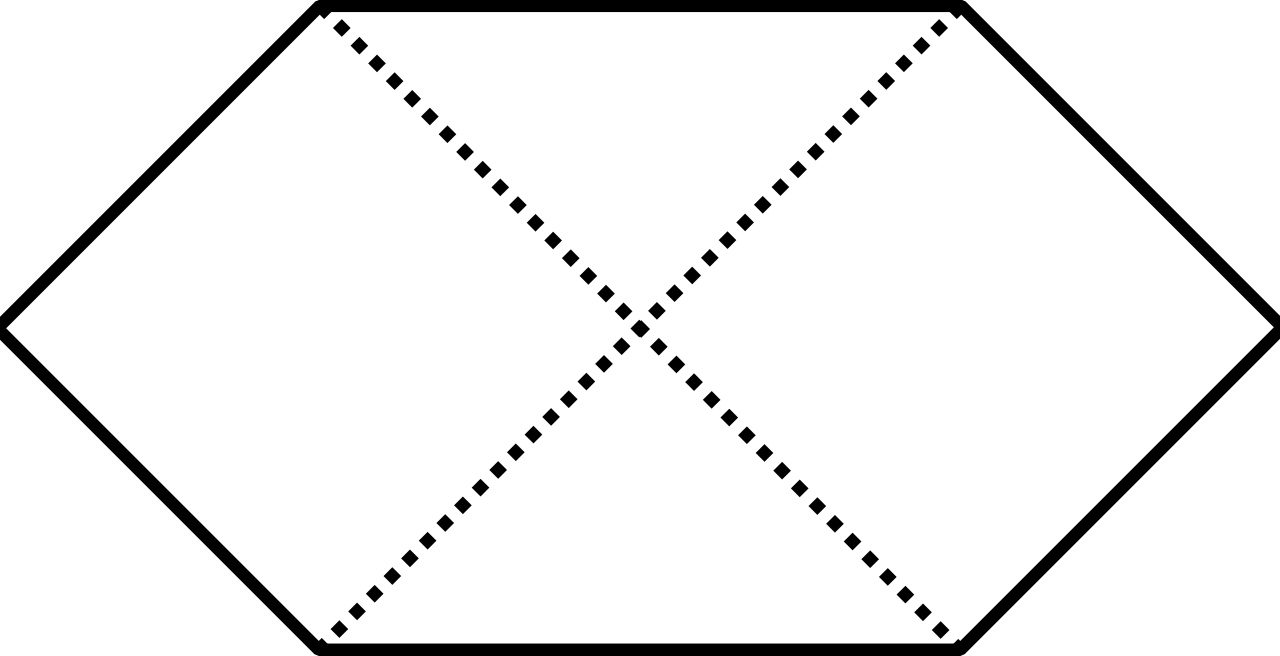
Penrose diagrams are frequently used to illustrate the causal structure of spacetimes containing black holes. In the Schwarzschild solution, singularities are denoted by a spacelike boundary, unlike the timelike boundary on conventional diagrams, due to the interchanging of timelike and spacelike coordinates within the horizon. The diagrams also illustrate the hypothetical Einstein–Rosen bridge connecting two separate universes in the maximally extended Schwarzschild black hole solution, though passage between the exterior regions requires faster-than-light velocity and is impossible. For rotating or electrically charged black holes, Penrose diagrams show inner event horizons and vertically oriented singularities that open a timelike wormhole, though these features are not stable under perturbations and are not believed to be realistic descriptions of interior regions.
Did You Know?
- Penrose diagrams are more properly (but less frequently) called Penrose–Carter diagrams, acknowledging both Brandon Carter and Roger Penrose.
- Two lines drawn at 45° angles intersect in the diagram only if the corresponding light rays intersect in the actual spacetime.
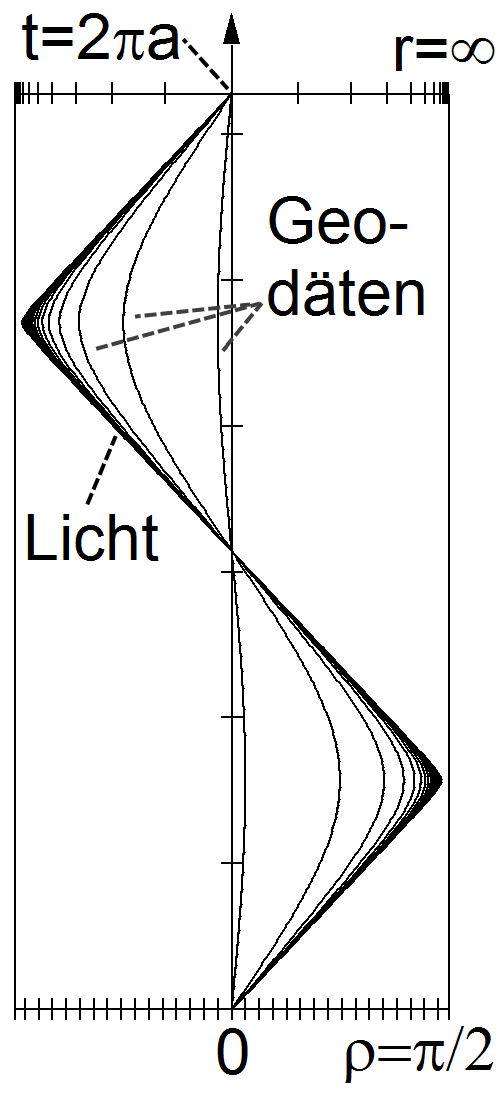
- The corners of the Penrose diagram, representing spacelike and timelike conformal infinities, are π/2 from the origin.
- Precursors to Penrose diagrams were Kruskal–Szekeres diagrams.
Core Concept and Geometric Design
A Penrose diagram is a two-dimensional representation of spacetime that encodes the causal relationships between events by applying a conformal transformation to infinity. Named for the mathematical physicist Roger Penrose, it generalizes the familiar Minkowski diagram of special relativity into the curved geometries encountered in general relativity. In this framework, the vertical axis denotes time while the horizontal axis represents a spatial dimension, and every light ray traces a path at exactly forty-five degrees when the speed of light is set to unity. The metric drawn on the diagram is locally conformally equivalent to the true spacetime metric, meaning angles and causal structure are preserved even though distances are rescaled. A carefully chosen conformal factor compresses the entire infinite extent of spacetime into a figure of finite size, pushing what would be infinitely far away onto the diagram's outer boundary. For spherically symmetric solutions, each individual point on the diagram actually stands for an entire two-dimensional sphere parameterized by the angular coordinates theta and phi, so the picture is a projection that folds angular information into a single dot.
Conformal Infinity and Coordinate Mapping
The defining mathematical trick behind a Penrose diagram is the compactification of infinite spacetime distances into finite positions on the page. Lines that would remain straight in an ordinary coordinate chart—lines of constant time or constant spatial coordinate—bend and converge toward the diagram's corners, which represent what Penrose first introduced in 1963 as conformal infinity. The more precise name, Penrose–Carter diagram, credits both Roger Penrose and Brandon Carter as the original developers, though the shorter label and the generic term conformal diagram are more common in practice. Two diagonal lines drawn at forty-five degrees cross on the diagram if and only if the corresponding light rays actually meet in the real spacetime, making the figure a compact visual test of causal accessibility. The slanted boundary edges encode null infinity or the location of singularities where lightlike paths terminate. For a flat Minkowski universe, the mapping from Cartesian coordinates x and t to the diagram's coordinates u and v is given by the tangent relation tan(u plus or minus v) equals x plus or minus t, and the spacelike and timelike infinity corners sit at an angle of pi over two from the origin.
Black Hole Causal Structure and the Einstein-Rosen Bridge
Penrose diagrams have become the standard tool for visualizing the causal architecture of black hole spacetimes. In the Schwarzschild solution, the singularity appears as a spacelike boundary rather than the timelike one seen in conventional diagrams, a consequence of the roles of time and space swapping inside the event horizon. Because space becomes one-directional within the horizon just as time is one-directional outside it, the diagram makes it visually unmistakable that any object crossing the horizon will inevitably reach the singularity regardless of any evasive maneuver. The diagrams also depict the hypothetical Einstein-Rosen bridge of the maximally extended Schwarzschild geometry, connecting two asymptotically flat exterior regions. Their direct precursors were the Kruskal-Szekeres diagrams, which first oriented the event horizon as past and future boundaries at forty-five degrees and split the singularity into horizontal past and future lines. The Penrose version adds the conformal compression of the distant flat regions. However, the bridge pinches shut so quickly that traversing it would demand superluminal speed, and an intense blue-shifted sheet of radiation would destroy any traveler. Moreover, the maximally extended picture does not model a realistic stellar-collapse black hole, since the collapsing star's surface replaces the white-hole sector entirely.
Rotating and Charged Solutions: Wormholes and Open Questions
When the black hole carries rotation or electric charge, the Penrose diagram reveals a richer internal geometry. These solutions possess inner event horizons situated in the future and singularities that orient vertically rather than horizontally, opening what is described as a timelike wormhole through which passage into future universes becomes, in principle, possible. In the rotating case specifically, an infalling observer who enters close to the axis of rotation can pass through a ring-shaped singularity—still rendered as a simple line on the two-dimensional diagram—into a so-called negative universe. Despite these tantalizing features, the literature is clear that such configurations are not stable under even small perturbations, and the physics community does not regard them as realistic descriptions of what lies inside actual black holes. The true nature of the interior regions of rotating or charged black holes remains an open problem in theoretical physics. The Penrose diagram thus serves not only as a tool for confirming what is forbidden but also as a map of the theoretical possibilities that current understanding cannot yet confirm or rule out.
Gallery
Frequently Asked Questions
Who is Penrose diagram?
Penrose diagram (also called a Penrose–Carter or conformal diagram) is a two-dimensional tool in theoretical physics that maps the causal structure of spacetime. It takes its name from the mathematical physicist Roger Penrose, who developed the conformal technique that makes the construction possible.
What are Penrose diagram's powers/role?
It compresses an entire infinite spacetime into a finite picture by applying a conformal transformation that pushes all points at infinity onto the diagram's boundary. Every light ray is drawn at exactly 45 degrees (with c set to 1), making causal relationships between events immediately readable at a glance.
How does Penrose diagram's story end?
Rather than ending, the diagram's narrative wraps up at its boundary, which represents the conformal infinity of the original spacetime. In this way, the full causal past and future of every event are visible within a single finite frame.
Why is Penrose diagram important?
It generalizes the flat-spacetime Minkowski diagram of special relativity to the curved geometries of general relativity, giving physicists a universal visual language for black holes, cosmology, and other GR solutions. Without it, comparing causal structures across different spacetimes would be far more difficult.
What's the difference between Penrose diagram and a regular spacetime diagram?
A standard Minkowski diagram only handles flat spacetime and leaves infinity off-page, whereas a Penrose diagram uses conformal rescaling to bring infinity into view and works for any curved metric. This makes it the go-to reference for visualizing global causal structure in general relativity.
More in Relativity And Spacetime 1-22
Spotted an error? Know more?
This is a living reference — every entry is fact-audited, and reader corrections feed straight into our audit queue. Suggest an edit · See this site's audit record